
Many times, talking to friends who work in other professions, I tell them how lucky we are, those of us who work in the IT industry. We, unlike 99% of the occupations, can create realistic environments for testing, learning, practicing… and when we are done with those environments we can destroy them and the expense of material will have been zero. How lucky we are!
Those of us who are passionate about computer security are even luckier; since its inception the cybersecurity community has been characterized by its defense of information freedom, free software and collective learning, which has made us the best time in history to learn about cybersecurity.
In this case, I want to make a guide to be able to build a Threat Hunting lab from home and at zero cost (not counting the investment of our computer).
Before we get started, let’s make a brief introduction about Threat Hunting, as it is important to settle the foundations of our laboratory.
1. What is Threat Hunting?
I once heard that if you want to know what Threat Hunting is and ask three experts, you will have four different opinions. Within the contemporary world of cybersecurity, Threat Hunting is one of the most recent disciplines and that makes both companies and researchers face it in a different way.
What everyone agrees on is that it takes companies a long time to discover that they have been compromised, and the average time between a breach and the discovery of the incident is six months. Why so much time to discover an intrusion? We could be talking for hours about this, about whether antivirus systems are prepared to face modern threats, about whether system administrators are sufficiently prepared or even whether or not it should be their responsibility to defend the organization… but no.
One of the things that characterizes Threat Hunting is the change in the research paradigm.
Traditional security assumes that the organization is protected, and the job is to keep it that way by creating rules, whether it be about a hash of a file, an IP address, an access to a route, a command… most of the time to control that no one enters the organization. When crossed against the events of a system, these rules generate alerts that an analyst evaluates whether or not they are false positives.
Threat Hunting works differently. We start from the assumption that someone has used a certain technique in the organization and our job is to check by all possible means if we are right or not. We have introduced the concept of “technique”, which brings us the currently so called TTPs (Tactics, Techniques and Procedures). This is a topic that we will not go into at the moment, but of course I invite you to go to Mitre ATT&CK’s page and discover this wonderful project.
As you can imagine, there are hundreds of techniques and for each one, several ways to detect them or several sources of information that we can use to detect them.
Although there are many possible approaches to Threat Hunting, in this series of articles we are going to focus on two main lines, the one based on network traffic analysis and the one based on computer event analysis. We already have some clear concepts so we are going to get down to work –
2. The events
Windows collects a lot of information in the form of default events and a lot of other information that we can configure. To work with them, Windows offers the tool “EventVwr” or “Event Viewer“. Let’s quickly mention the most interesting types of events from the point of view of Threat Hunting.
Security Logs
Perhaps one of the most important that we can analyze. In these events many actions of users, programs and services that occur on the computer are recorded. We have from events related to files to special permissions assigned to a login. Here is a link to a list of events that is very useful to have close by.
Powershell
To find these events, it will be necessary to search for them in the path “Application Records/Microsoft/Windows/Powershell/Operational“.
Here we can see some information, but in order to see as much information as possible for each PowerShell session we need to activate the “PowerShell Transcript“. This will allow us to know not only the commands executed in Powershell, but also the responses of those commands. Here is a link to a Powershell tutorial to activate it.
Sysmon
Here is the crown jewel. Sysmon is a project within the Sysinternals suite. It is composed of a driver and a service, the driver is in responsible for monitoring the equipment waiting for certain calls to the system and when it detects them, it generates events.
Anyone could think that if we already have the events of the system itself, why generate new events? The native events of Windows are too diverse and in many cases it is very hard to work with them; however Sysmon currently offers 23 types of events, making the work much easier for the analyst.
I leave you the link to the Sysmon documentation where all the events are discussed.
3. The Laboratory
Although as we have mentioned before there are two approaches to Threat Hunting, one based on network traffic analysis and the other based on team events, we are going to focus initially on the second one and for that we are going to install the HELK project.
HELK
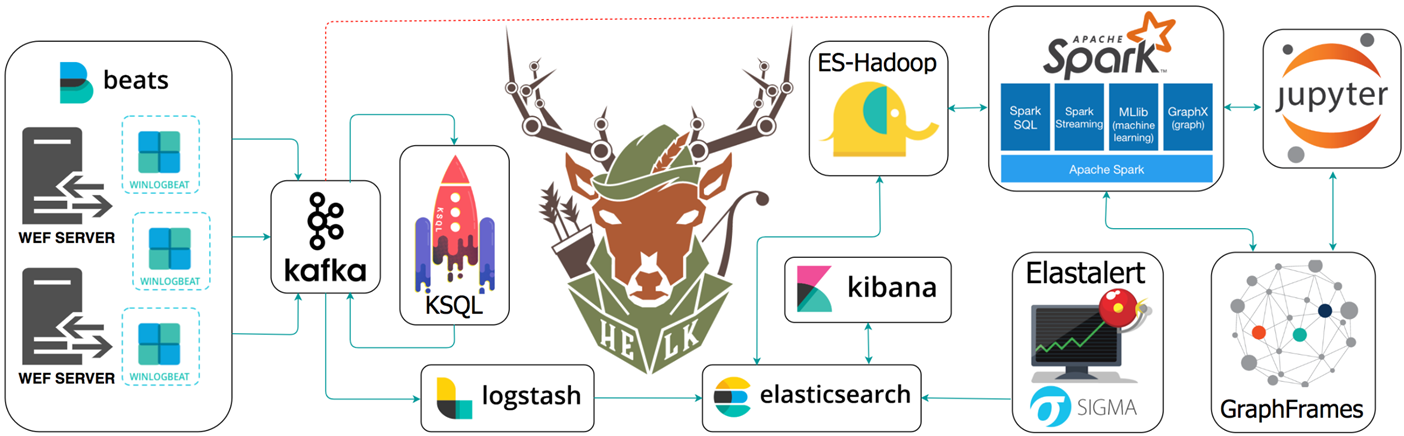
HELK is a project developed by Roberto Rodriguez and based on the architecture of Elastic Seach, Logstash and Kibana, although it is much more than that, as you can see in the image.
For the installation of the laboratory we will need a Linux machine, preferably Ubuntu, and depending on the characteristics we want in our laboratory with different specifications. But first we are going to talk about what features it offers so that we can choose later.
Kafka and KSQL
This is an information reception system, specialized in concurrence and fault tolerance; it allows our laboratory to receive information from many systems without this being a problem. It will also serve to add information from datasets, but we will talk about that later.
KSQL is the technology that will allow Kafka’s data to be consumed.
ELK
Elastic Search, Logstash and Kibana. It is increasingly difficult not to build an architecture like this into a project and a growing number of free software projects are based on it.
- ElasticSearch is a non-relational database; its greatest power lies in the indexing of large amounts of data, its distributed architecture and its API.
- Logstah is in charge of preparing the data to be stored in ElasticSearch: grouping, organizing, enriching… everything is possible in logstash.
- Kibana is the visual part of this architecture; from it we can create queries and visualizations about our data.
Elastalert
Elastalert allows the creation of rules on the data we have in ElasticSearch and to be able to generate alerts of many types, we will talk about it more in detail.
Spark and Jupyter
Spark is a framework that allows to execute Jupyter playbooks and that will allow to generate playbooks with the intelligence that we take out of our investigations. We will work with it also later.
4. Installation
Once we know the most essential parts of the project we will talk about the different installation methods that HELK allows.
| Opción | Componentes | Requisitos de memoria |
|---|---|---|
| 1 | KAFKA + KSQL + ELK + NGNIX | 5GB |
| 2 | KAFKA + KSQL + ELK + NGNIX + ELASTALERT | 5GB |
| 3 | KAFKA + KSQL + ELK + NGNIX + SPARK + JUPYTER | 7GB |
| 4 | KAFKA + KSQL + ELK + NGNIX + SPARK + JUPYTER + ELASTALERT | 8GB |
To start the installation we’ll download the Github project with Git and run the installer:
git clone https://github.com/Cyb3rWard0g/HELK.git

…

cd HELK/docker
The installation uses Docker containers, but we don’t have to worry about it, HELK will install it if we don’t have it. We’re going to make a change in a configuration file so we can work with Grafiki more comfortably later.
During this tutorial we are going to install the full HELK, so we will need to modify the file “helk-kibana-notebook-analysis-alert-basic.yml” in the “HELK/docker” location. On line 20, we will add the configuration so that port 9200 is open to the outside of the Docker container. It should look like this:
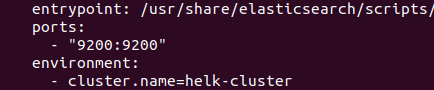
Once this detail has been modified, we will proceed with the installation.
sudo ./helk_install.sh
The installation script will ask what installation option we want and we will choose option 4. Remember that the installation machine must have more than 8GB of RAM. Then it will ask for the IP address we want in the installation, and we will choose the default one. Then it will ask for a password to allow access to Kibana and that’s all; we will wait until the installation is finished. It will show something like this:
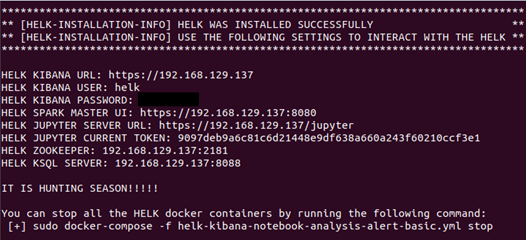
Save this data in a handy place because it will be needed later.
So far, so good ;-) We already have our research panel deployed! And now that we already have a platform to store the data we have to get data… but we’ll see that in the next entry.