
The data
In the last post we set a platform to store the data. Now we need to feed it with some data. One way would be to install Windows virtual machines, Winlogbeat and Sysmon, but we will do that later. Now I want to talk about Mordor.
Mordor

This project, also maintained by Roberto Rodríguez and José Luis Rodríguez, is a repository of pre-recorded events while offensive techniques were executed on laboratory machines.
As expected, this project integrates perfectly with HELK and provides us with very interesting data to start hunting our threats. So, let’s go.
We open a new console and download the Mordor repository.
git clone https://github.com/Cyb3rWard0g/mordor.git

...

cd mordor/datasets/small/windows
In this folder we have all the datasets organized by Mitre ATT&CK tactics. For this example we are going to use “execution/empire_wmic_add_user.tar.gz“.
cd execution

tar -xzvf empire_wmic_add_user.tar.gz
The decompressing will show us the name of the unpacked file. It is important to look at the date when the events were recorded, so it will be easier to find them afterwards.
Now we are going to use the tool “kafkacat” to insert our data into ElasticSearch through Kafka.
kafkacat -b 192.168.129.137:9092 -t winlogbeat -P -l

empire_wmic_add_user_2019-05-18231333.json
Now, in order to see the events, we open a browser tab and enter the IP address that HELK gave us at the end of Kibana install. Probably the browser will complain about the certificate; accept and continue. With regard to the password to access Kibana, we enter the one set during the installation, and the user “helk”, getting into the Kibana menu below.
To check that we have our events stored, we access “Discovery“, with a image of a compass. Let’s see briefly what we see in that page.
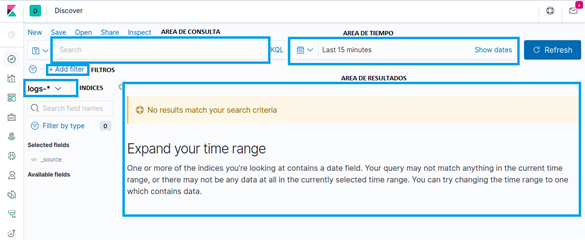
- In the consultation area (“AREA DE CONSULTA”) we create the consultations (fairly obvious).
- In the time area (“AREA DE TIEMPO”) we create time filters based on absolute or relative dates, origin and end.
- The filter area (“FILTROS”) allows for an easy way to filter the data.
- In the index section (“INDICES”), we select the index or group of indexes we want to work on. It accepts wildcards.
- In the results area (“AREA DE RESULTADOS”) we see and organize the obtained results.
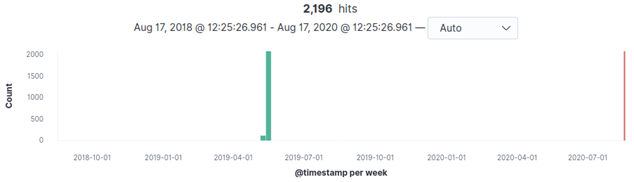
To start to see the data introduced, we set a relative date of 2 years ago and after refreshing (if everything went smoothly), it informs that there are 2196 results between the 6th and the 13th May 2019.
We already have our data to start the hunt. I recommend to spend some time on this part to get familiar with the fields of the events, columns, filters, etc.
EVTX-ATTACK-SAMPLES
Another essential repository in our library is the one created by Samir Bousseaden, which together with Mordor are the two most complete repositories available. In this repository, Samir has been collecting Windows events of offensive techniques in “EVTX” format and has organized them by MITRE ATT&CK tactics in more than 200 different files. A real feat.
To work with this repository, we do the same as before: clone it, and later we will see how to introduce it in our laboratory.
git clone https://github.com/sbousseaden/EVTX-ATTACK-SAMPLES.git
Since we are dealing with files in EVTX format, we need to format the data to insert it in ElasticSearch. We can make that with the “evtxtoelk” tool.
With the following commands we download the repository, install Pip and the necessary dependencies.
git clone https://github.com/dgunter/evtxtoelk.git

cd evtxtoelk/

sudo apt install python3-pip

pip3 install –r requirements.txt

pip3 install –upgrade requests
Once everything installed, we need to modify the file “evtxtoelk.py” and add a “#” to line 98. It should look like this:
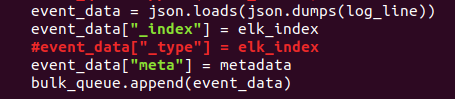
Save the file and we’re ready to insert the EVTX files into ElasticSearch. We need to provide two parameters to the etxtoelk file: the file we want to enter and the IP address we entered in the HELK installation.
python3 evtxtoelk.py /home/luis/EVTX-ATTACK-SAMPLES/Defense\

   Evasion/sysmon_10_1_ppid_spoofing.evtx 192.168.129.137:9200
If everything went without errors, we got our data in ElasticSearch. However, in order to see it in Kibana we need to make one last adjustment.
Evtxtoelk creates an index in ElasticSearch called “hostlogs“, that can be modified executing the command with the parameter “-i index_name“. To be able to see the index data, go to the “Management” section of Kibana, the cogwheel on the left menu. Once in the management section, in the Kibana section, click on “Index Patterns” to access the index management page.
By default all index patterns created by HELK during the installation will show, but we have to create one. We can do that clicking on the blue button “Create index patern“. In the section of “Index pattern” we write “hostlogs*“; if we have set a different name in the index with evtxtoelk we have to use it here.
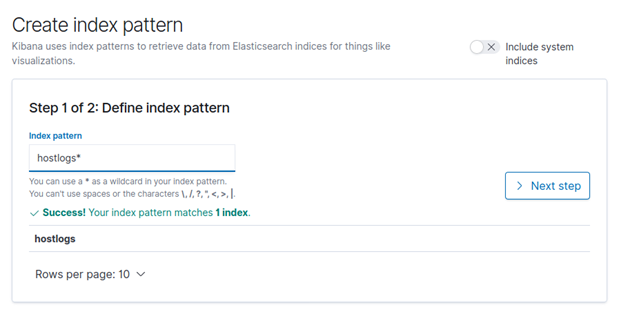
Click on “Next step” and once in the next menu, select “@timestamp” and click on “Create index pattern“.
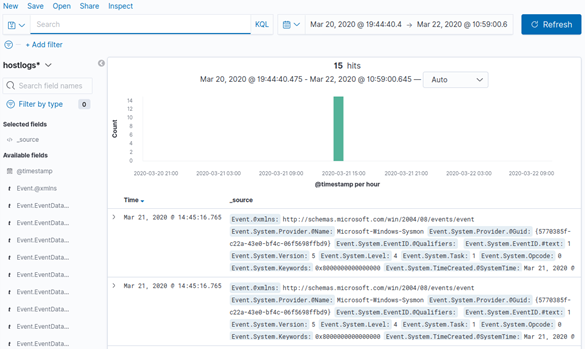
We created our index pattern. Click on the “Discovery” section, the compass we know, and once there, in the index selector that should now have “logs-*“, we select the new created “hostlogs” pattern. Maybe we need to tweak with the time window so that it shows our events, but in the end we see something like this.
So… Congratulations! We now have everything needed to start inserting attack data and begin your search and learning. In the next article we will continue talking about the advantages of HELK and install Grafiki to get more out of our events.
I hope you enjoy the lab and that the hunting season begins!
Excelente trabajo, te recomiendo revisar el link inicial, redirige al mismo contenido