
=> I: acquisition and processing
=> II: simple analysis
=> III: not so simple analysis
=> IV: conclusions
Once we have answered some silly & simple questions, it’s time to wonder more complex ones, so let’s imagine…
Are CNA threat actors increasing their activities during last years?
In the simple questions, we have concluded that sabotage and destruction motivations are not the most common among threat groups. But we are interested in these ones. Let’s see them among time:
for i in `grep "Sabotage and destruction" [0-9]*.txt|awk -F: '{print $1}'`; do grep \"meta\",\"date\"\] $i|awk '{print $2}'|sed 's/\"//g';done|awk '{a[$0]++}END{for(k in a){print k,a[k]}}’ >years.cna
Plotting the results, we have:
gnuplot> set boxwidth 0.5

gnuplot> set boxwidth 0.5

gnuplot> set xtics 1

gnuplot> set ytics 1

gnuplot> set yrange [0:5]

gnuplot> plot 'years.cna' with boxes
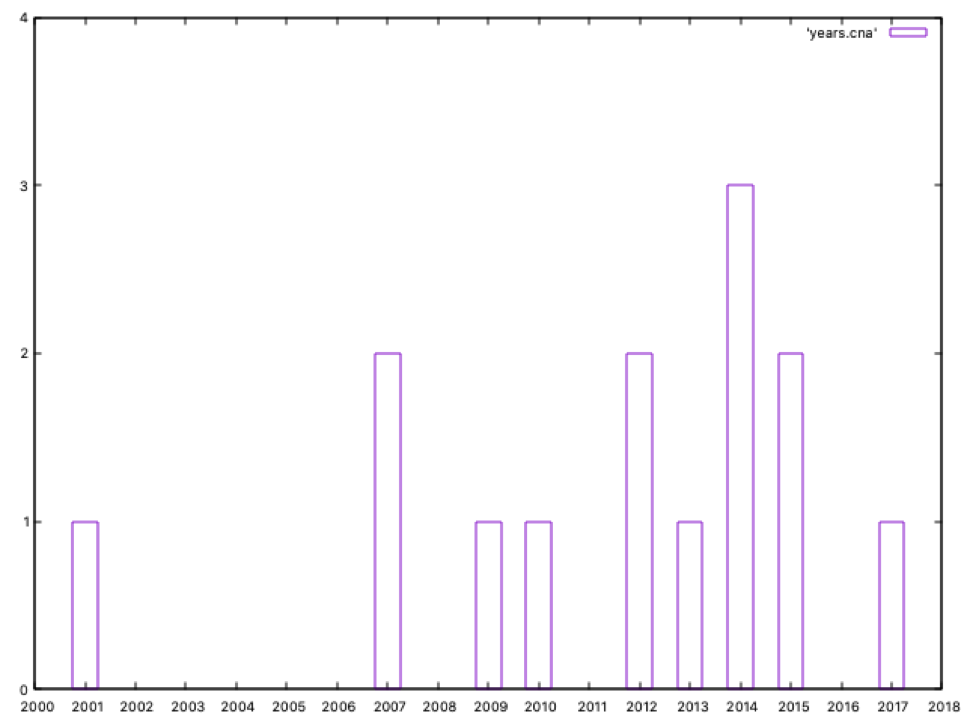
Since 2012, the number of these threat actors has increased significantly: 9 out of 14 groups in the last eight years, so we can say it’s a growing trend. Out of curiosity , the oldest group with CNA capabilities is dated in 2001. Can you guess its name? Yeah… Equation Group.
Which are the countries with more CNA capabilities?
Let’s look for the main hostile countries performing destructive or manipulation operations:
$ for i in `grep "Sabotage and destruction" [0-9]*.txt|awk -F: '{print $1}'`; do grep \"meta\",\"country\"\] $i|awk '{print $2}'|sed 's/\"//g';done|awk '{a[$0]++}END{for(k in a){print a[k],k}}'|sort -n

1 KP

1 US

1 US,IL

2 IR

7 RU

$
Russia has seven identified threat groups performing those operations; far, far away from Iran, with only two threat groups… Without any doubt, Russia is the champion in this ranking!!!
And what about cyber crime? What about threat actors focused on pure economic interests?
We can perform a similar query than before to get these results:
1 "BY"

1 "BY"

1 "IR"

1 "IT"

1 "KZ"

1 "PK"

1 "RO"

1 "SA"

1 "UA"

2 "US"

3 "KP"

6 "CN"

27 "RU"
Once again, the gold medal is for Russia also when talking about cybercrime groups.
So Russia is the champion… can we focus on its information needs?
Sure. Let’s see which sectors and countries are the ones targeted by Russian actors. In first place, look at the target sectors:
$ cat russia.sh

#!/bin/sh


for i in [0-9]*.txt; do

        grep -w RU $i >/dev/null

        if [ $? -eq 0 ]; then

                grep cfr-target-category $i

        fi

done |awk -F\" '{a[$8]++}END{ for(k in a){print a[k],"\x22"k"\x22"}}'|sort -n

$ ./russia.sh  >temp

$
Now let’s prepare our data to be plotted:
$ awk '{print k++,$2,$3,$4,$1}’  temp >sectors.ru #sorry for the quick hack

$
gnuplot> set boxwidth 0.5

gnuplot> set xtics rotate by 45 right

gnuplot> unset key

gnuplot> set style fill solid

gnuplot> set title "Russian target sectors"

gnuplot> plot "sectors.ru" using 1:3:xtic(2) with boxes
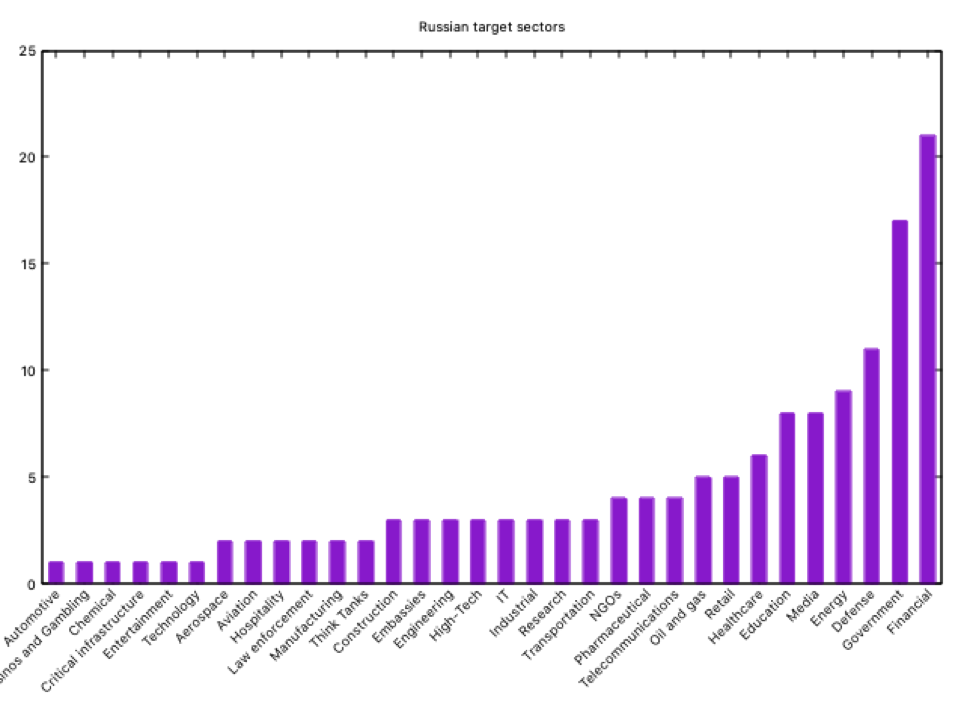
As we can see, the main targets of the Russian Federation are the financial, government, defense, energy and media/education. The “media” sector as a target is very curious… or it is not?
Now let’s look at the countries; modifying our script, and looking only for countries that have been targeted by at least five groups -simply for graphical reasons-, we get the following graph:
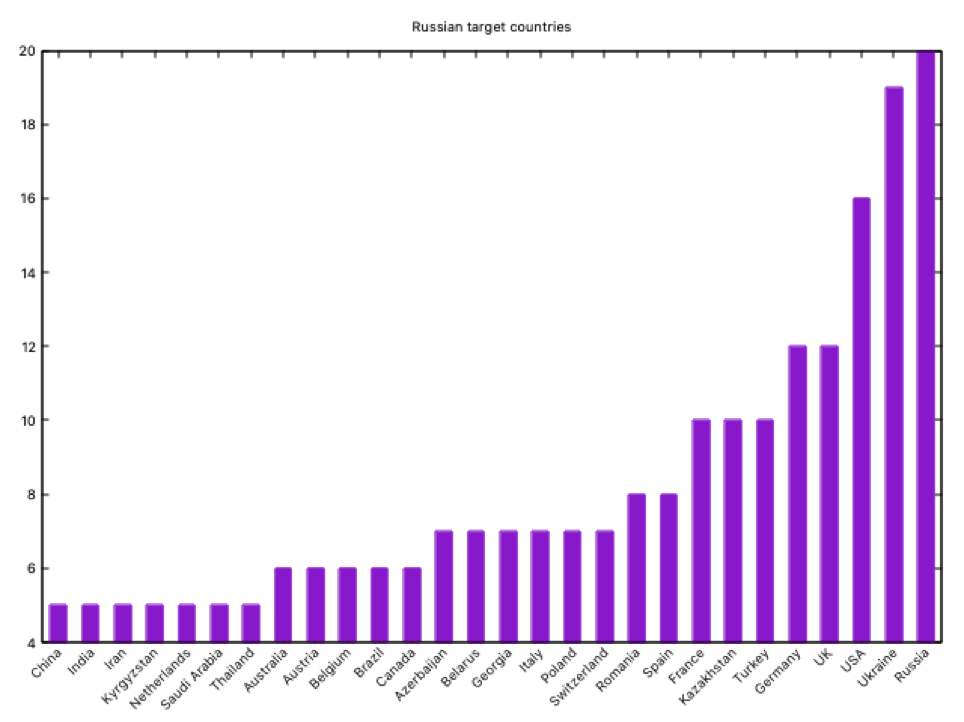
The first Russian target is… itself!! Well, it may not be a surprise if we deep into Russian intelligence (remember our older posts about the Russian Cyber Intelligence Community??). After Russia, we can confirm the Russian geographical areas of interest: ex-USSR republics and NATO mainly. Well, not a surprise if you know anything about Russian intelligence.
Which countries are entering the APT arena in the last years?
First, we generate the datafile extracting the country and year from every threat group card -and labeling them with a sequential number in order to plot-:
#!/bin/sh

for i in [0-9]*.txt; do

	c=`grep \"country\"\] $i|awk '{print $2}'|sed s/\"//g`

	y=`grep \"date\"\] $i|awk '{print $2}'|sed s/\"//g`

	if [ ! -z $c ] && [ ! -z $y ]; then

		echo $c $y

	fi

done | awk 'BEGIN{k=1}{if (a[$1]=="") {a[$1]=k++} ; {print $2" "a[$1]" "$1 }}’
Now let’s draw our work:
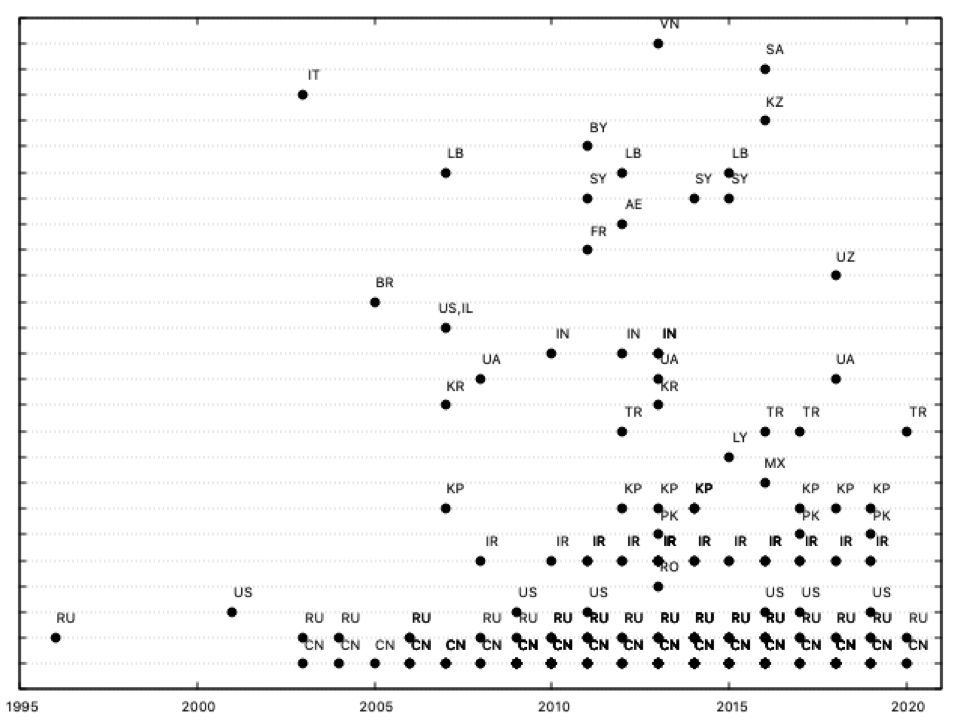
As we can see, during the last ten years KP (North Korea) and, specially, IR (Iran), have been particularly active, increasing its activities, together with the usual actors (China, Russia or US). Other countries which were active during the first five years of the decade (SY, Syria, or IN, Indonesia, for example) now seem less active -or at least, its new threat groups are not discovered-; a detail: the old groups from these countries can also be active now… it’s a little detail we’ll comment now.
I work for a Fortune 500 company. Can I have a magic quadrant for APT groups?
Sure. Gartner does its research to position technology players within a specific market and represent them in a Magic Quadrant (https://www.gartner.com/en/research/methodologies/magic-quadrants-research). These quadrants classify each player into four categories (leaders, visionaries, niche players and challengers) by analyzing its “ability to execute” and its “completeness of vision”.
For our quadrant, let’s consider “Ability to execute” as the period each actor has been active, and consider “Completeness of vision” as the diversity of targets. Why this criteria? We can consider (well, more or less… remember this is not an IEEE paper but a blog post!) that an ability to execute can be estimated by the years a threat actor has been active (this is, has been executing operations); this is an interesting point: data gathered from APT groups from ThaiCERT source marks only its “foundation” date, not the period they have been active. It should be necessary the use of a “last time seen” data to estimate a real ability to execute.
On the other hand, the completeness of vision is calculated by the number of targets a threat group has, both considering countries and sectors. A simple criteria: the more targets you have, the more complete is your vision… perhaps not exact from an academic point of view, but remember what we said about the IEEE paper :)
Following our criteria, we can draw the first version of our Magic Quadrant; first, we can write a simple script to get the data, extracting for each threat actor its name, country (later we’ll see why we are interested in the country), number of sectors and target countries and years active:
$ cat extract.sh

n=`ls [0-9]*.txt|wc -l`

for i in $(seq 1 $n);do

        t=`grep "$i,\"value" $i.txt|awk -F"\t"  '{print $2}'|sed 's/\"//g' `

        name=`echo $t|awk -F, '{print $1}'`

        country=`grep \"country\"] $i.txt|awk '{print $2}'|sed 's/\"//g' `

        date=`awk 'index($1,"date")>0 {print $0}' $i.txt |awk '{print $2}'|sed 's/\"//g' `

        y=`date +%Y`

        ability=`expr $y - $date`

        sectors=`grep -w cfr-target-category $i.txt|wc -l`

        countries=`grep -w cfr-suspected-victims $i.txt|wc -l`

        completeness=`expr $sectors + $countries`

        echo $name:$pais:$completeness:$ability|awk -F: '{if($3>0 && length($2>0) && $4>=0){print $0}}'

done

$ ./extract.sh >data 2>/dev/null

$
This script generates an output with the following format:
$ head data

Aggah::31:2

Allanite::3:3

APT 3:CN:17:13

APT 4:CN:6:13

APT 5:CN:5:13

APT 6:CN:2:9

APT 12:CN:9:11

APT 16:CN:7:5

APT 17:CN:21:11

APT 19:CN:12:7

$
Let’s format this file:
$ awk -F: '{print $3" "$4" ""\x22"$1"\x22"}' data >quadrant

$
And let’s also make a “nice” magic quadrant:
$ cat quadrant.plot

set title "APT groups"

set xlabel "Completeness of vision"

set ylabel "Ability to execute"

set format y ""

set format x ""

unset key

set parametric

set arrow 1 from 40,0 to 40,25 nohead

set arrow 2 from 0,12.5 to 80,12.5 nohead

plot 'quadrant'  w labels point pt 7 offset char 1,1

$
So it’s done, as we can see:
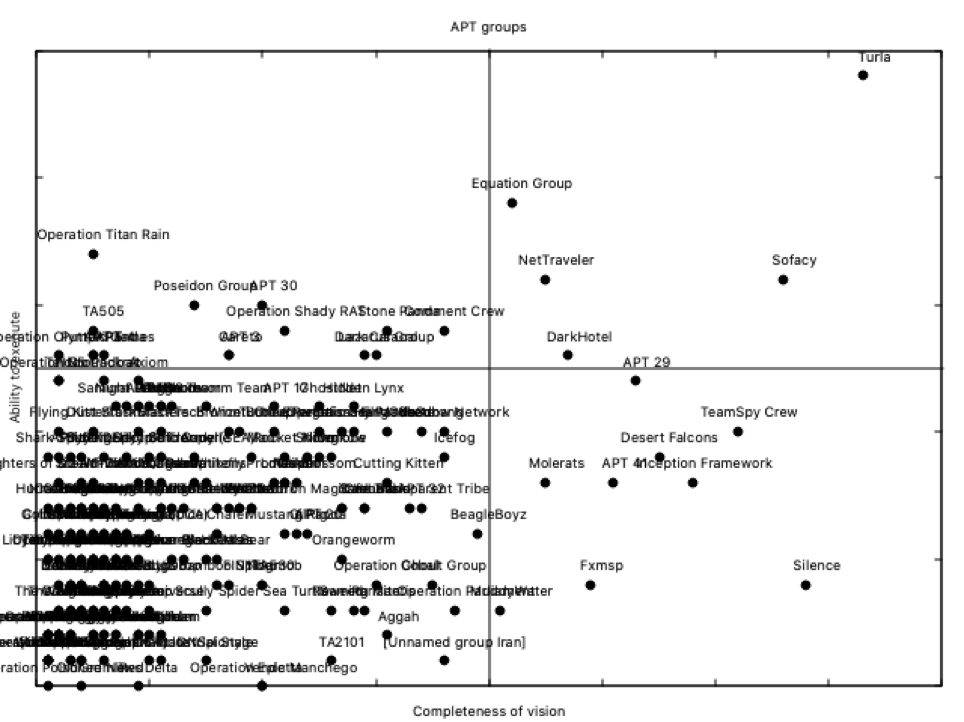
Definitely, not a nice Magic Quadrant suitable for our marketing team, but suitable to get interesting conclusions: Turla is a LEADER, as well as APT28 or Equation Group. Now you can say in your conference why Russia is the champion (remember also when talking about CNA): two out of its groups in the upper right side of the Magic Quadrant.
But inside Russian groups, the Champions League, how could this magic quadrant be? As you remember, we included the country code for each group in our previous script; this is useful to draw national magic quadrants. For example, the Russian one:
$ awk -F: '$2=="RU" {print $3" "$4" ""\x22"$1"\x22"}' data gt;quadrant.russia

$
Changing the title in our previous .plot file, and loading this new data file, we can get the Russian APT magic quadrant:
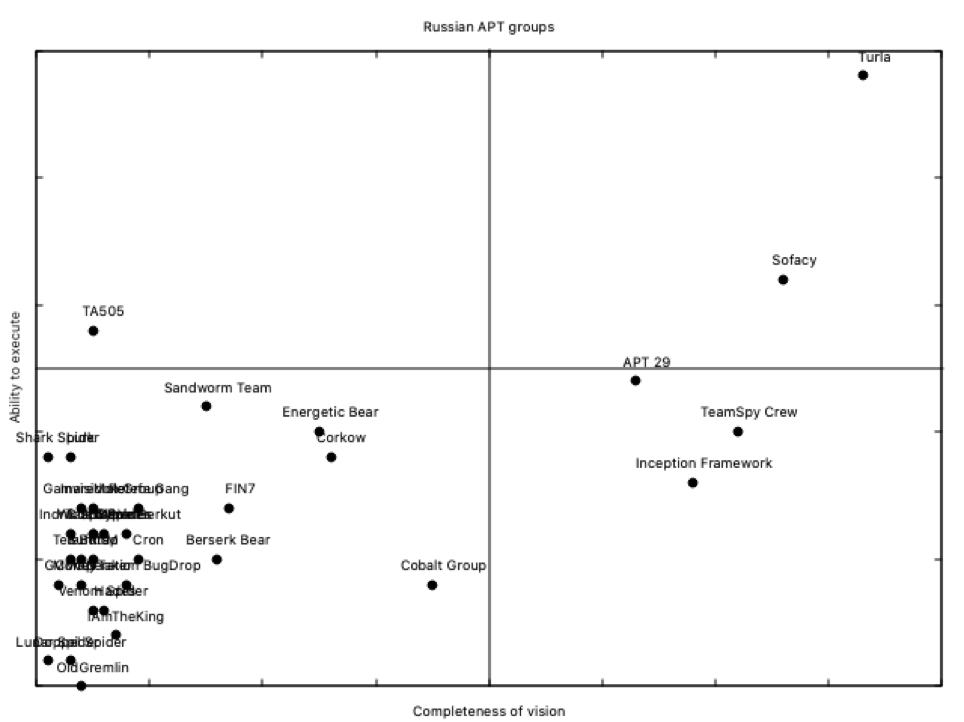
Please note that as Turla is a Russian group, and it was the clear leader from the previous global magic quadrant, and there are also Russian groups in the lower side, there is no need to change plot parameters; if we try the same with Chinese groups, a little adjust has to be done to get this result:
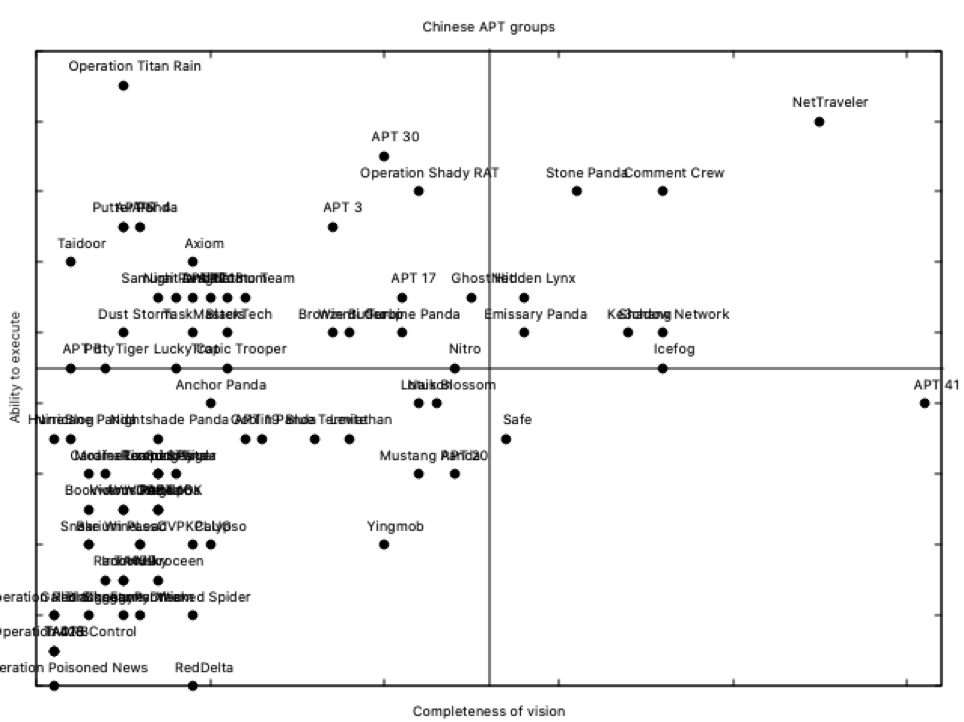
NetTraveler is the leader here; operating since 2004, and with 4 target sectors among 41 target countries, it’s definitely a robust threat group. Resilient, as we can call them now :)
Can I have more sentences for my APT talks?
With a little help from AWK and gnuplot you can generate your own statistics, magic quadrants for your favorite country or any other data or correlation you may need. Apart from that, ThaiCERT maintains another JSON file with data related to the tools used by threat actors, so enjoy!!