=> I: acquisition and processing
=> II: simple analysis
=> III: not so simple analysis
=> IV: conclusions
Now you have some tips, evidence-based, for your APT talks (don’t forget to use these tips together with Sun Tzu’s “Art of War” quotes); with some more time, you can get to more stupid or interesting conclusions about threat groups activities, interests and origins. And exploiting other datasets (MITRE ATT&CK, here we go!) We can expand those conclusions.
Some key data we can conclude after this little analysis of data:
- It seems clear that Russia plays in the APT Champions League. It’s the most active country in all kind of threat activities, from sabotage to espionage or financial gain.
- The threat group leader is also a Russian one: Turla, operating from almost a quarter century -in this case we can confirm it’s still active- and with targets from a long list of countries and sectors.
- The most loved by analysts threat group is also a Russian one: APT28. Maybe for this reason is the threat group with more synonyms.
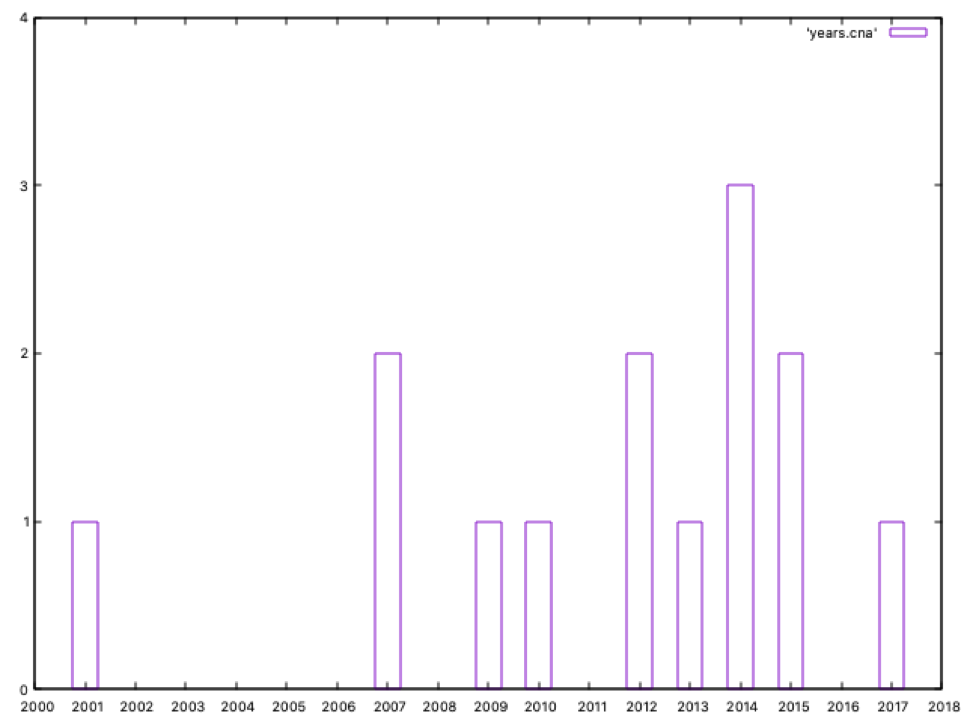
- The number of threat actors with CNA capabilities has increased during last years, once again with Russia leading the ranking.
- Apart from classical players, two actors have been particularly actives in the last years: Iran and North Korea.
- It should be interesting to identify a parameter for threat groups, something like “last time seen”, in order to calculate the years a group has been active.
- Using different, vendor-dependent names, for the same threat actor is a little chaos when analyzing data. In this sense, a good effort is MISP’s UUID for each group (https://github.com/MISP/misp-galaxy/blob/main/clusters/threat-actor.json#L2434), as @adulau noted.
- With some imagination and gnuplot you can have your own APT Magic Quadrant for marketing purposes.
- Disclaimer: this is just a simple blog post, not a scientific paper, so don’t expect non questionable sentences here!
- And the most important conclusion: AWK is your friend. Remember:


