
See first and second part.
Hey, hunters! How’s the hunting season going?
After what we saw in previous posts, in this article we will continue to understand and improve our Threat Hunting lab.
We have already learned how to enter our data about real attacks and now we will learn how to exploit that data. Being able to visualize the data in a comfortable way is, along with selecting good data sources, the most important part of a laboratory. All the time we invest in an intuitive and pleasant visualization will be time saved during the analysis.
Now we are going back to the laboratory, this time we are going to learn how to handle some of the HELK functionalities that we have not seen yet.
The Laboratory – Data Visualization
Kibana Dashboards
The Kibana dashboards are the visual part offered by the HELK laboratory. From Kibana it is possible to create visualizations and dashboards visually very attractive that allow, at a glance, to know if we are facing something suspicious or not.
To do this, HELK has several dashboards that we will cover briefly. To see them, click on the icon in the right-hand side menu that says “Dashboard”.
1. ALL-MITRE-ATTACK
It provides a practical and easy to use visualization of the techniques, tactics, APT groups… available in Mitre ATT&CK. Very useful to quickly see which techniques are attributed to a group or similar needs.
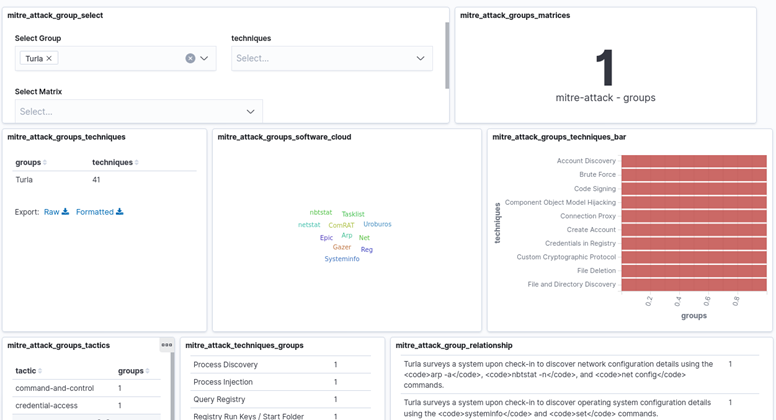
2. MITRE-ATTACK-GROUPS
This visualization allows the investigation of an APT group by the data about it in Mitre ATT&CK . The dashboard provides a search form and shows a number of very interesting visualizations.
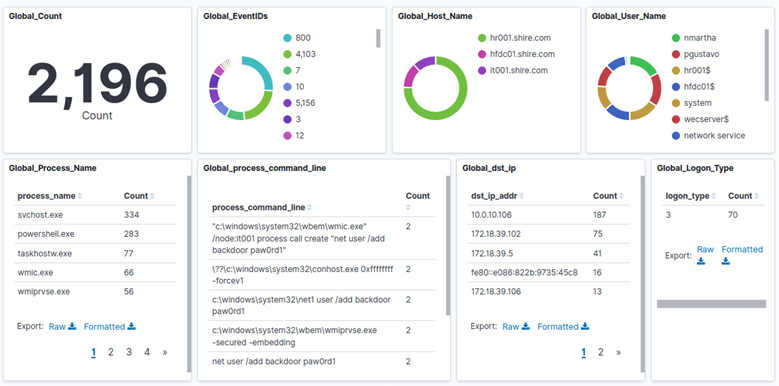
3. Global Dashboard
This dashboard offers a quick visualization of all the existing events in the lab in the time range set; this is a very useful dashboard when you do not know what you are looking for.
For example, it allows you to see quickly if a computer is generating more events than normal, if a process is being very noisy or if more requests are being made to an IP than expected.
4. Host Investigation Dashboard
This board is very useful when you know something has happened on a computer and more detail is necessary about the events related to that computer. The dashboard requires the name of the computer to investigate and the range of dates we are interested in.
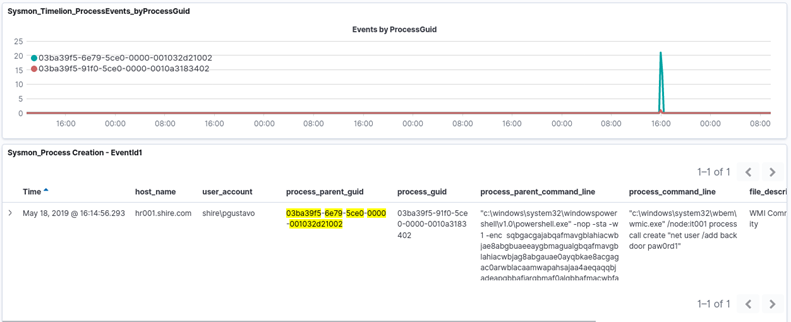
5. Process Investigation
As the previous dashboard allowed to investigate a computer, and in this board it is possible to investigate the actions of a specific process using its GUID.
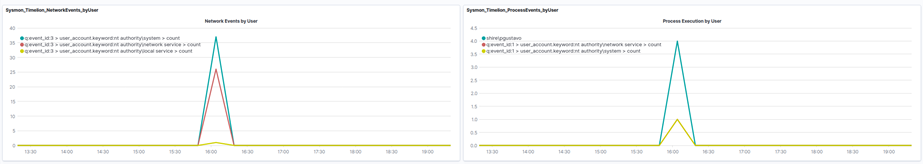
6. User Investigation Dashboard
Like the previous ones, from here it is possible to investigate the events, but in this case those related by a specific user.
7. Sysmon Dashboard
This board is the same as the Global Dashboard, but only with the data sent by Sysmon.
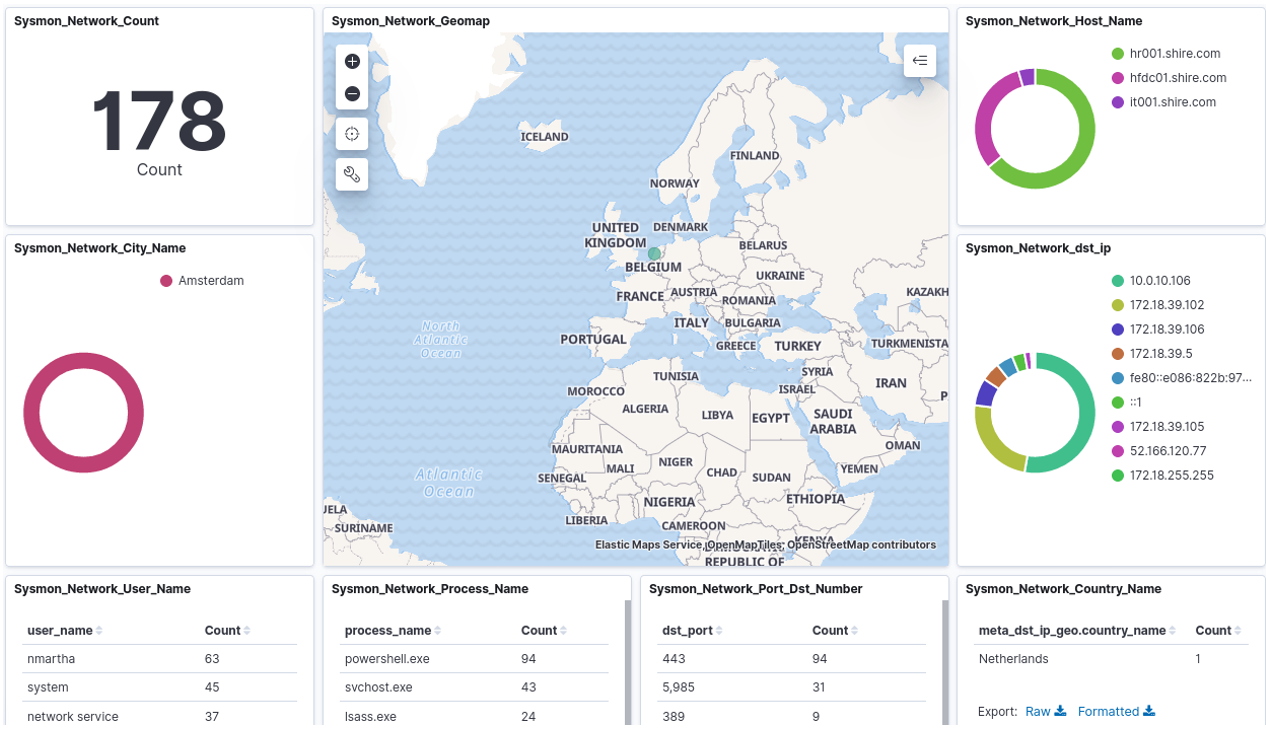
8. Sysmon Network Dashboard
This board allows to investigate events 3 of Sysmon, i.e. those related to network traffic. It makes possible to discover which processes on which computers are making network connections and to which countries.
Apart from all these, HELK has many other dashboards, without forgetting that Kibana offers the possibility of creating our own in a very comfortable way.
In the next entry, we will see Grafiki, a personal project that allows a visualization of the data with graphs, and I am sure that it will be very useful. Until then, happy hunting!