
See first, second and third part.
Today’s post covers something very special to me.
In the previous entry we saw the exploitation of information with Kibana and its usefulness in seeing potential anomalies at a glance. After a lot of work with Kibana, spending many hours creating visualizations and dashboards, there was one visualization that I missed: the graphs!
In that sense, I read some time ago the sentence “Defenders think in lists. Attackers think in graphs“.
Although it can raise a lot of controversy, if that were true it would leave us, defenders, at a clear disadvantage. In a world where threats are increasingly complex, being able to “connect the dots” makes the difference between finding our threat or not.
From this idea and an increase in my free time due to lockdown, Grafiki emerged. Let’s take a look at it.
Grafiki
This project aims to create a new way of working with Sysmon events. Because the events are independent in themselves, as a developer I needed to store all that information in a relational database format to make queries more intuitively.
Thus, from each event, the entities that participate in it, processes, registry keys, files… are extracted and all of them are related independently, with one or several relationships for each event.
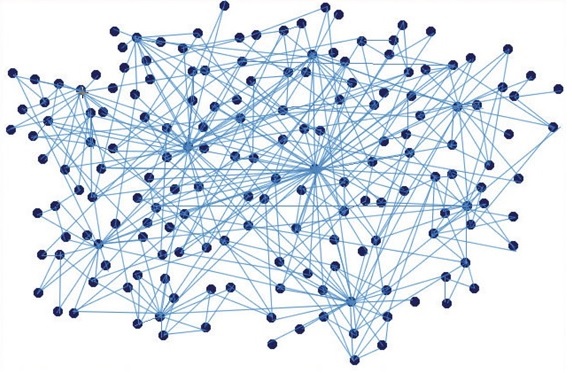
Once the information is organized, the logical evolution is to paint the data as what they are: entities relating to each other. As you can see, the result is amazing.
Installation
The first thing we will do is to install it in our laboratory machine. The installation is very simple; we open a terminal and enter the following commands:
git clone https://github.com/lucky-luk3/Grafiki.git

cd Grafiki/

chmod +x setup.sh

sudo ./setup.sh

cd grafiki

python3 manage.py runserver
If everything went well, the application will ask to access the URL http://127.0.0.1:8000/ with the browser to access the tool. Once there, at the top we see the different sections of the application. Let’s go for “Examples“.
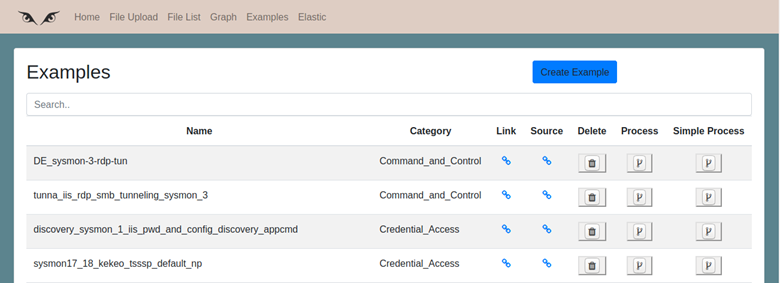
Do you remember the Mordor and EVTX-ATTACK-SAMPLES repositories? Well, here are stored all the links to the event files of both repositories, organized by the Mitre ATT&CK tactics, so it will be easier to investigate them without having to enter them in ElasticSearch.
For each example, we have a link to download the file and a link to the author’s repository, plus two different types of processing: normal processing and simple processing.
In simple processing, a simplification of the graph is performed by grouping processes with the same name, and removing some elements of the graph such as threads. This functionality can be very useful in some cases to simplify the graph, but sometimes it can be misleading, so the two options should be properly evaluated.
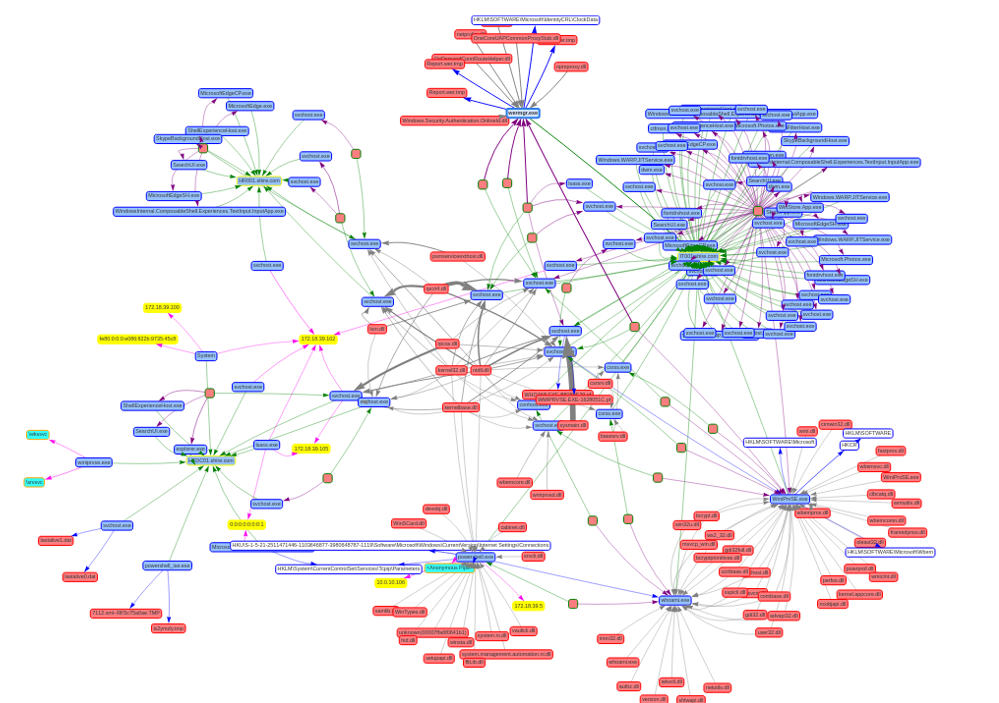
To show the capabilities of this section, we will use the same file loaded in previous post. We introduce in the search bar the text “empire_wmic_add_user“, click on the “Process” icon, and the application will download the event file from the repository, transform the events and create the graph, which we will see after a few seconds.
Here is our first graph!
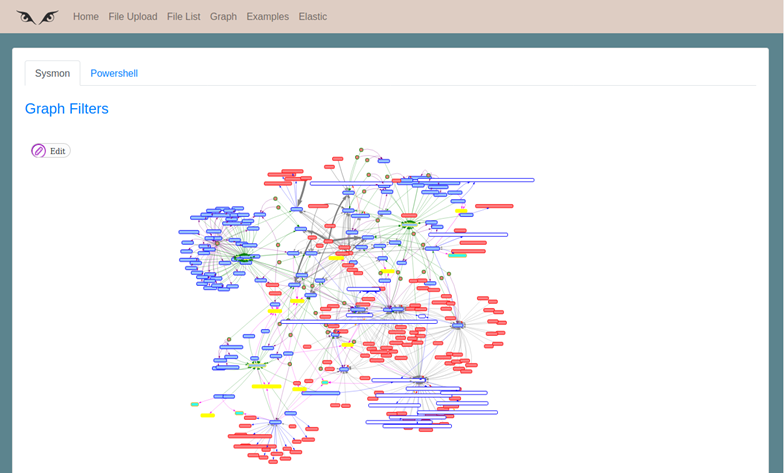
Although this file is not one of the largest, it may contain too much information to work comfortably. Clicking on “Graph Filters”, all the graph options will be displayed. Let’s take a look at them, as this is where much of the charm of the project lies.
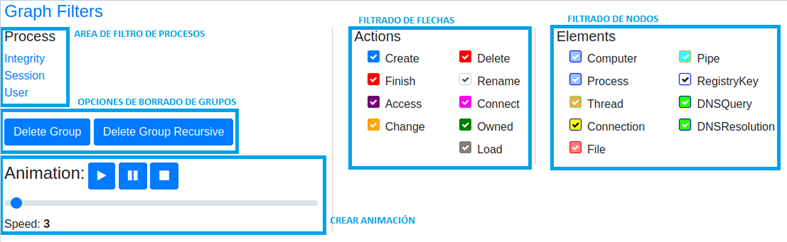
A. Process Area
As seen in the image, there are three different filters in this section: by integrity, by session and by process user. Clicking on any of the filters will display a list of available options, taking into account the graph data.
B. Deleting groups
This option allows to remove entire groups of processes from the graph. To do this, select the central node of the group, i.e. the process that has generated the others, and “Delete Group“. The recursive delete option recursively deletes all processes created by the selected process. This option is very useful for deleting branches of the graph that are not of interest to us.
Please note that the deletion action cannot be undone, so to show again a deleted node it will be necessary to generate the graph again.
C. Animation
From this section it is possible to create an animation with the events of the graph. When you click on the play button, the elements of the graph will disappear, and the nodes and the arrows representing the actions will appear in order of creation. This section is very useful when the order of the actions is very relevant to the analysis, as in the case of “Parent PID Spoofing“.
D. Filtering Arrows and Nodes
From this section it is possible to hide some nodes or actions at our convenience. This option is reversible, so do not be afraid to apply it to see more clearly the events.
After deleting the nodes we are not interested in and making some filtering, it will be much easier to see only what we are interested.
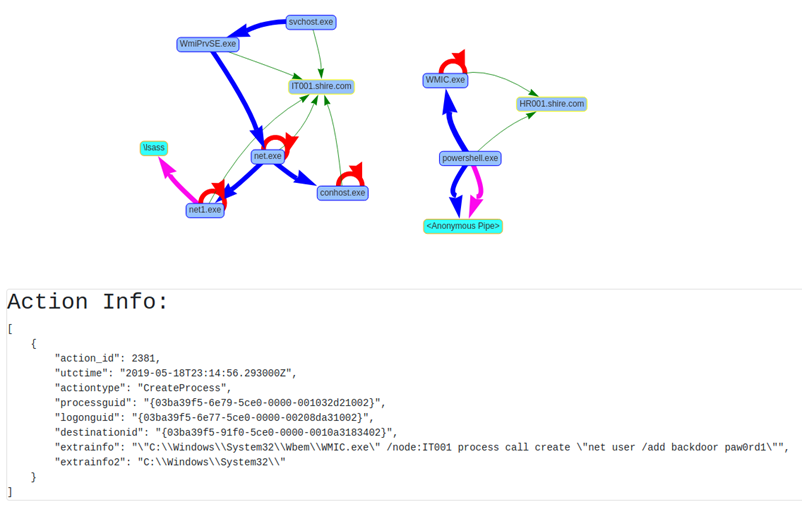
In the image above we see the computer “HR001” executing a Powershell process through a WMI command on the computer “IT001“, to add the user “backdoor“. The “Action Info” information below it is shown when you click on an arrow, offering information about the event it represents.
The video below shows the animation function on this small graph, so that the order of events can be better appreciated.
In the section “File List” and “File Upload” it is possible to upload our files, in EVTX format, in JSON format of Elastic events, and in CSV format. Both the JSON and CSV formats are very flexible so it is possible that it gives errors, so it may be necessary to modify the code according to our needs.
Elastic section
The last part of Grafiki I want to show is the “Elastic” section. This section allows to make graphs of the events stored in our laboratory. To do this, it will be necessary:
- Modify the file “elastic.py” in the path “Grafiki/grafiki/app/static/Python/src/“
- In line 53 and line 58 enter the IP address of HELK.
Let’s see the options in this section:
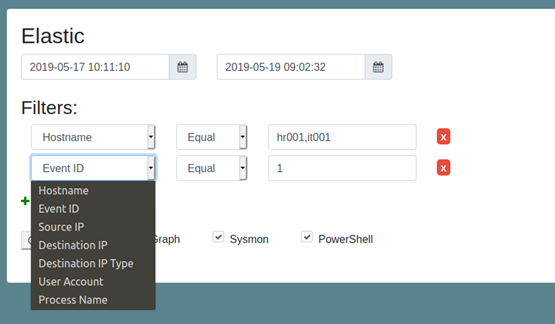
As seen in the image, the first to be selected is a timeframe, which depending on the amount of data we have in our laboratory will require more or less accuracy.
Second part are the filters, which allow to limit the data we take to the graph, being able to choose the operator equal or not equal, depending on our needs.
The filters currently implemented are:
- Name of the computer, very useful when the computer to be investigated has been identified.
- Sysmon event identifier. For example, in many occasions looking at the type 1 events we can already get an idea of what is happening.
- Source IP, destination IP and type of destination IP (private or public), events related to network connection events.
- User related to the processes.
- Process name, very useful to exclude very noisy processes.
An important feature that can be seen in the image is the possibility to include several possible values to our filter, separating the elements with commas. The query will be constructed using the logical “OR” operator between those elements, while the “AND” operator will be used between each of the filters.
And finally, at the bottom it is possible to select whether we want always a processing, and whether we want the events related to Powershell to be processed (beta functionality).
In the next article we will move to the action with the creation of alerts and creation of playbooks.
In the meantime, enjoy the lab and happy hunting!