
Welcome to this new post on our home laboratory, which is gradually growing more and more.
In this article we will create a testing machine to play without fear, and we will deal with the necessary configurations to log everything that happens in it.

In the second post we talked about the existing event repositories, more specifically about the Mordor project and the EVTX-ATTACK-SAMPLES repository.
These repositories are very useful for understanding and learning about how many threats behave, and they make the work much easier, but when the work is already done you don’t learn as much. With your own machine we can try out new techniques and see how they are detected in the laboratory.
It is important to bear in mind that it will not be a virtual machine in which malware will be executed, as the level of isolation will not be sufficient to guarantee the security of the host computer.
1. Operating system installation
To start, we need to install a Windows virtual machine. I will use VMware but there is no problem using other virtualization software.
There are two options for downloading the official version directly from Microsoft, which I strongly recommend since any other source may pose a security problem.
The first option is the virtual machines offered by Microsoft to test Microsoft Edge, which you can find in this link. In the form, you must select the version you want to download and the virtualization software you are going to use.
These virtual machines are valid for 90 days but, as recommended by Microsoft, it is best to snapshot the virtual machine when the configuration has been done and return to it whenever necessary. It should be noted that the information will be stored in Elasticsearch’s laboratory and the bait information is not necessary.
The other option is to download the Microsoft installation media creation tool. This tool is intended for the installation of final versions of the licensed operating system, which means that the key will be requested when the installation is performed and although it allows you to continue without the key, it is not what the tool was developed for. This tool will create an ISO file to be used during the creation of the virtual machine.
With either method, the result is a virtual machine with Windows 10.
2. Sysmon
Sysmon is an important part of the laboratory, since it will be one of the sources of information that will allow detailed monitoring of the system based on its events.
It can be downloaded from the official Sysinternals site. Before the installation it is important to talk about the configuration file.
At the time of writing, Sysmon registers 24 events. Some of these events, such as event 7, library load by a process, generate a lot of information load, so in production environments you have to be very careful.
What Sysmon logs is controlled by the configuration file that must be set at the time of installation. For production environments, the most famous configuration is the one made by the user SwiftOnSecurity. This link shows you the configuration and how complex a Sysmon configuration can be.
In order to assemble a laboratory machine, it is not necessary to have such a careful configuration. Since as it is a single machine, a more “noisy” configuration can be created.
Here you can download the Sysmon configuration that I use in my lab. It is a configuration made by Olaf Hartong and provides an appropriate log level for a laboratory.
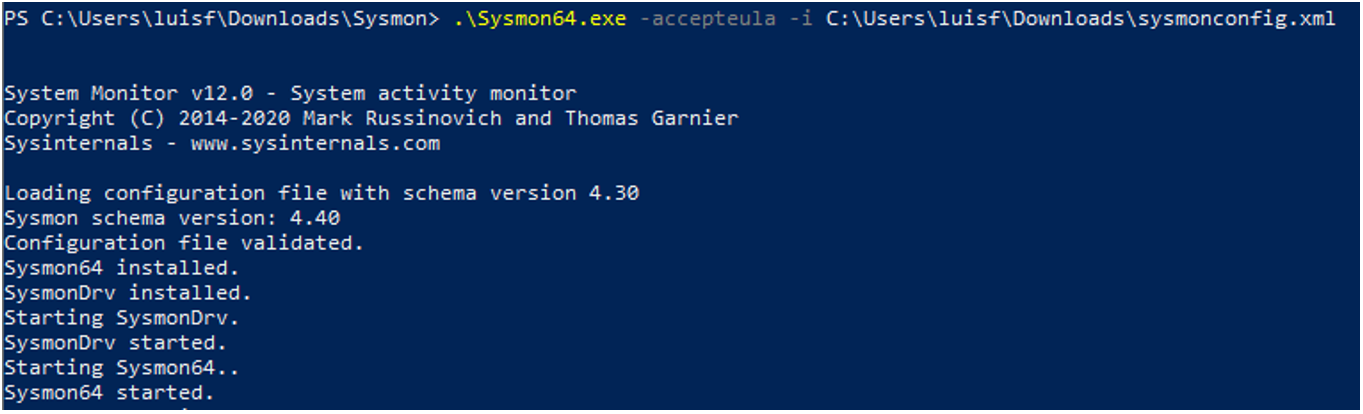
For the installation and execution of Sysmon, the following command will be enough:
.\Sysmon64.exe -accepteula -i C:\Users\luisf\Downloads\sysmonconfig.xml
And the result should look something like this:
In the path “Application and Service Logs/Microsoft/Windows/Sysmon/Operational/” of the Windows event viewer we will see the events that Sysmon is collecting from the system.
3. Winlogbeat
Within the entire ecosystem that started with Elasticsearh, small packages have emerged that make it much easier to inject data into the database.
This is the case of Winlogbeat. This package allows to automate the insertion of data from a Windows machine into Elasticsearch. It can be downloaded from this link.
Its installation is also very simple and as with Sysmon, a custom configuration file is required, which can be edited with a text editor.
3.1 Configuration file
In this link is the configuration that they propose in HELK. Inside the configuration file you can see several parts.
- The first section is the events.log. In this section the data sources that Winlogbeat will collect from the equipment are configured. Do not worry about the format of these sources, the package will format them.
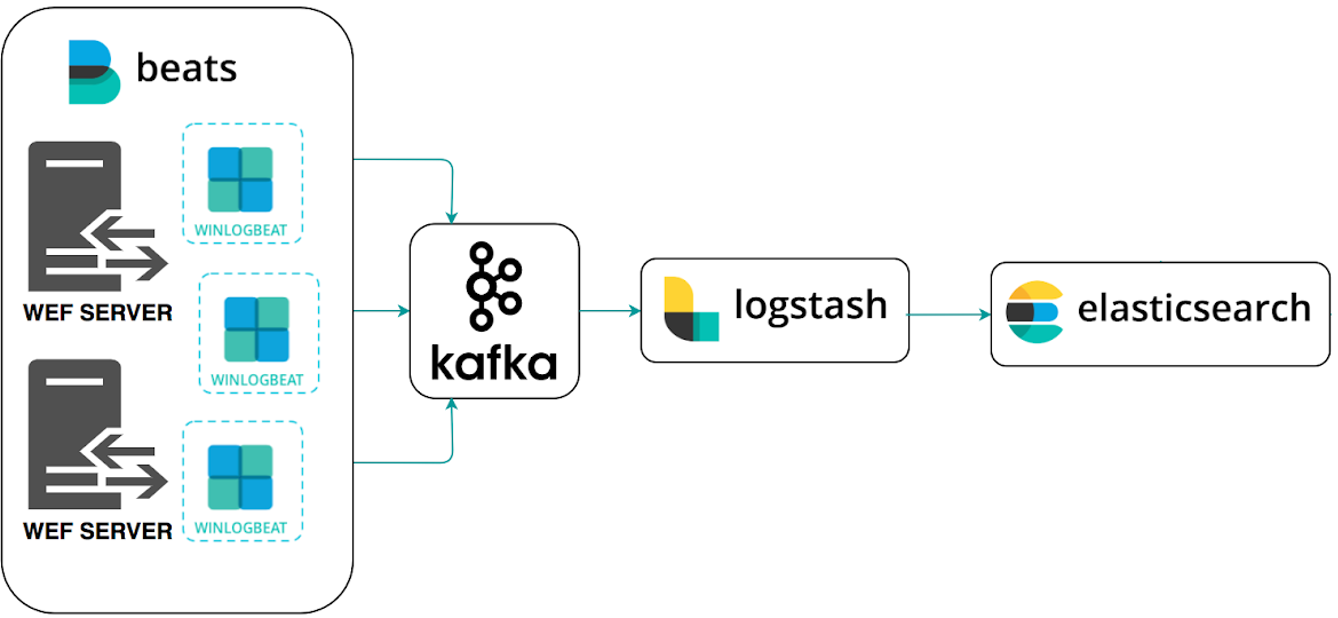
- The second section is the outputs. In this section you have to tell Winlogbeat where to send the information. In our case it is better to simplify the architecture and send the data directly to Logstash. To do this you will need to enter the following at the end:
#----------------------------- Logstash output --------------------------------
output.logstash:
hosts: ["192.168.129.137:5044"]
Remember to enter your HELK IP and comment by adding “#” in the output to Kafka.
3.2 Download and installation
The download is done from this link, where you can find the compressed file with everything you need.
Once downloaded, it must be unzipped in the folder “Program Files” and:
- Change the folder name from “winlogbeat-<version>” to “Winlogbeat”.
- Change the file winlogbeat.yml to the one previously downloaded from the HELK project.
Almost done!
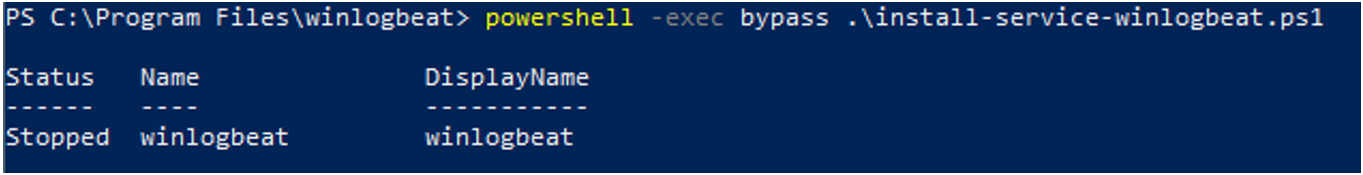
Now, from a Powershell console as administrator, we will run the file “install-service-winlogbeat.ps1“, which will install the Winlogbeat service but will not launch it.
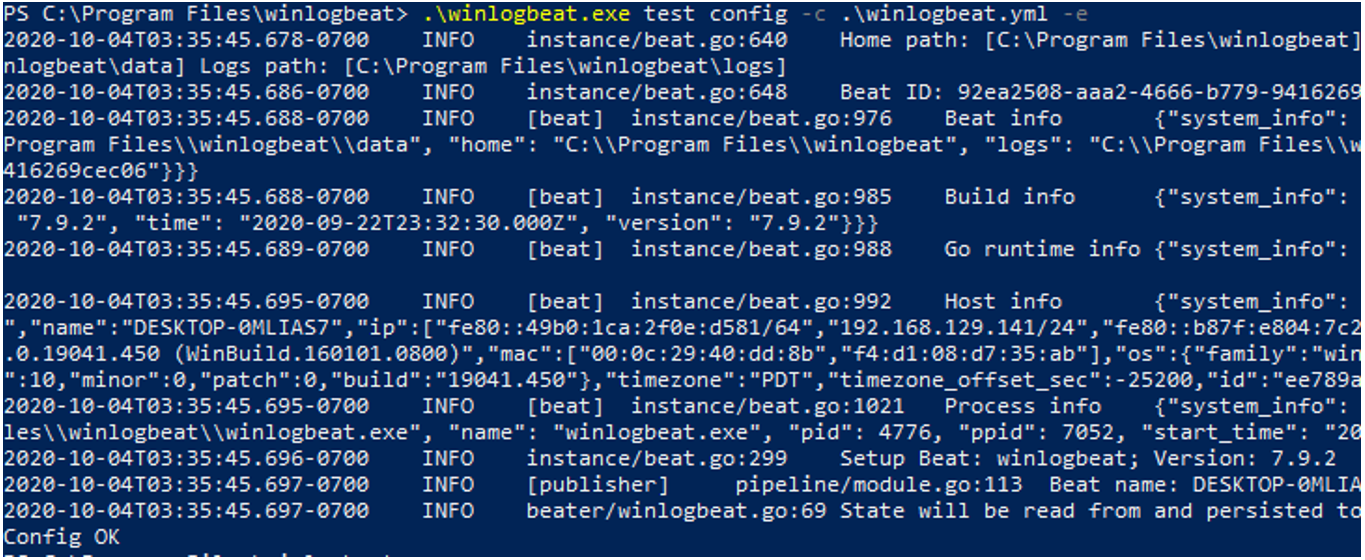
To test that the configuration is correct, we will execute the following command, entering the path of the configuration file that was modified in the previous step:
.\winlogbeat.exe test config -c .\winlogbeat.yml -e
If everything went well, it will show “Config OK” at the end of the answer:
Everything goes smoothly. Now we will launch the Winlogbeat service, and from the Windows service manager, it will appear as an active service.
Start-Service winlogbeat
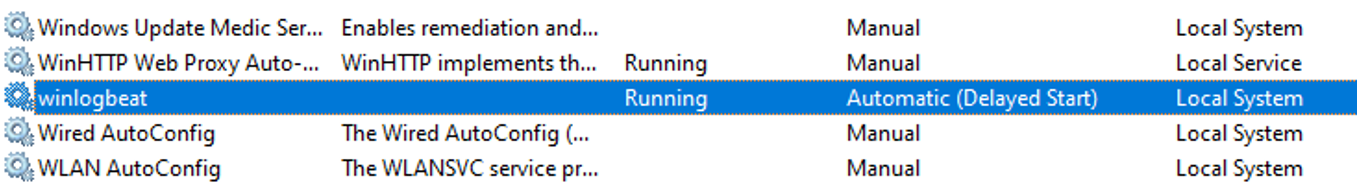
It’s already working!
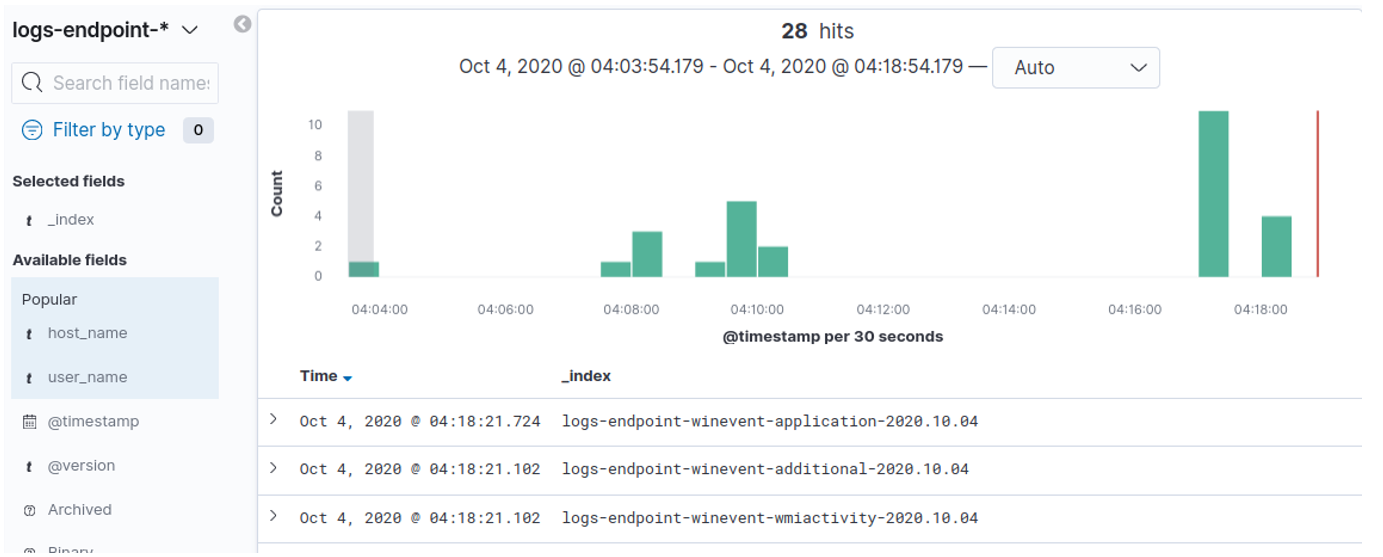
If so, in the HELK virtual machine, in the Kibana window, in the “Discovery” section, the events that the lure is generating will appear. Remember that the events generated by Winlogbeat will be indexed by Elastic in the “logs-endpoint-winevent-*” index.
Now we have a new machine to play with!
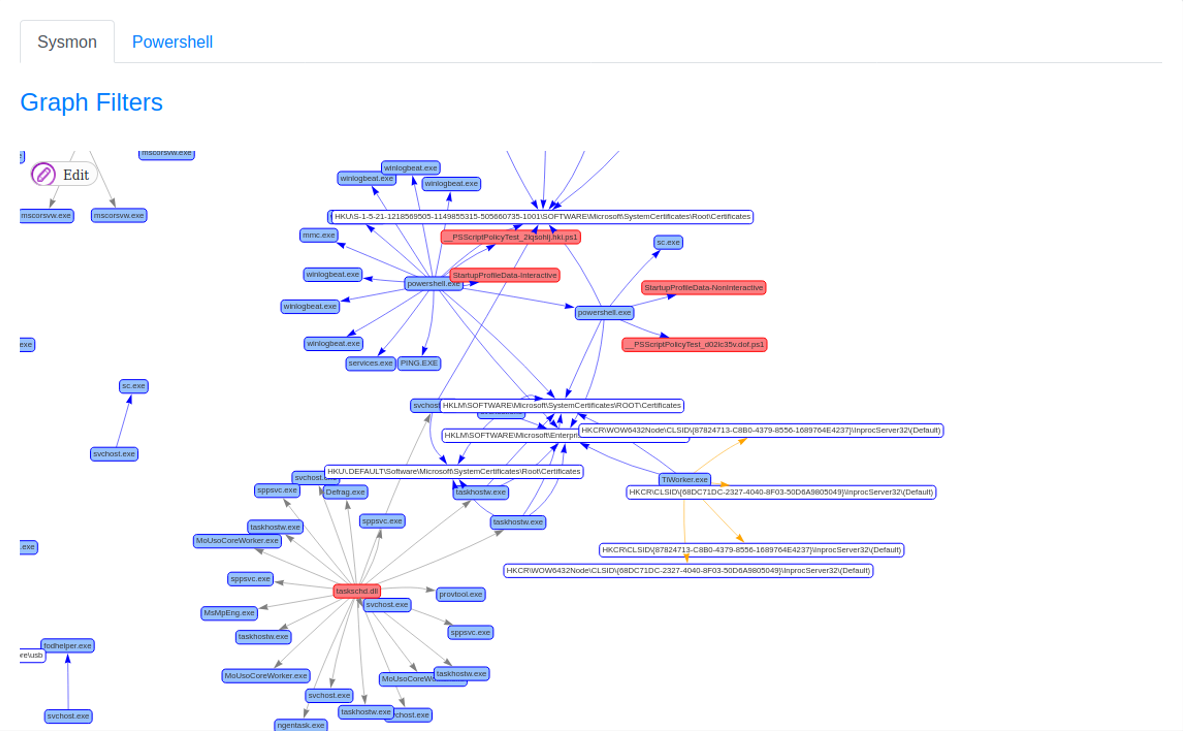
With this, from Grafiki it is now possible to visualize the data. If you enter an appropriate date range and generate the network, it will show something like this:
Now, the most important tip of the day: make a snapshot of the virtual machines, now that everything works.
Finally we got the lab working, at least for the time being. Now it’s time to put on the hunter’s boots and get into the mud.
In the next posts we will address issues related to offensive techniques and how to detect them in the laboratory, how Windows works, Sysmon … many interesting things.
Happy hunting!