Threat hunting (IV): cazando sin salir de casa. Grafiki

Ver primera, segunda parte y tercera parte.


Teoría de Grafos: Análisis relacional de las Redes Sociales

Hoy traigo un artículo sobre algo muy especial para mí.

En la entrada anterior hablamos sobre la explotación de la información con Kibana y su utilidad en ver de un vistazo posible anomalías. Después de mucho trabajar con Kibana, dedicándole muchas horas a crear visualizaciones y dashboards, había una visualización que echaba de menos: ¡los grafos!

En ese sentido, hace tiempo que leí la frase “Los defensores piensan en listas. Los atacantes en grafos“.

Aunque puede levantar mucha controversia, de ser eso cierto nos dejaría a los defensores en una clara desventaja. En un mundo en el que cada vez las amenazas son más complejas, ser capaces de “unir los puntos” marca la diferencia entre encontrar nuestra amenaza o no.

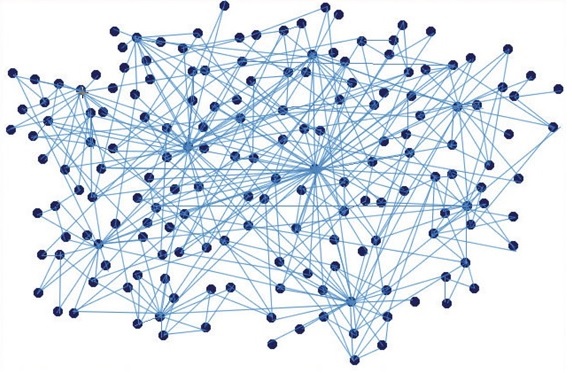
De esta idea y de un aumento de mi tiempo libre por el confinamiento, surgió Grafiki. Vamos a verlo.

[Read more…]

Threat hunting (IV): hunting without leaving home. Grafiki

See first, second and third part.


Teoría de Grafos: Análisis relacional de las Redes Sociales

Today’s post covers something very special to me.

In the previous entry we saw the exploitation of information with Kibana and its usefulness in seeing potential anomalies at a glance. After a lot of work with Kibana, spending many hours creating visualizations and dashboards, there was one visualization that I missed: the graphs!

In that sense, I read some time ago the sentence “Defenders think in lists. Attackers think in graphs“.

Although it can raise a lot of controversy, if that were true it would leave us, defenders, at a clear disadvantage. In a world where threats are increasingly complex, being able to “connect the dots” makes the difference between finding our threat or not.

From this idea and an increase in my free time due to lockdown, Grafiki emerged. Let’s take a look at it.

[Read more…]